|
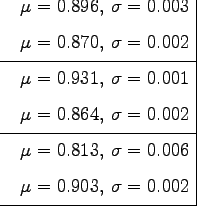
Table 8.1 presents the results of the comparisons for the videos generated from the video sequences V1, V2 and V3. Each training video is compared with each model using the measure described in the previous section for both position and speed data. The bold labels represent lines where our model is significantly better than the autoregressive process. We can see that our model outperforms the autoregressive process for structured videos, while maintaining good results for the unstructured video.

|
The videos corresponding to the entries in table 8.1 can be found on the accompanying CD-ROM. The videos:
examples/V1/V1_arp.m1v,
examples/V1/V1_wr.m1v,
examples/V1/V1_wor.m1v
examples/V2/V2_arp.m1v,
examples/V2/V2_wr.m1v,
examples/V2/V2_wor.m1v
examples/V3/V3_arp.m1v,
examples/V3/V3_wr.m1v,
examples/V3/V3_wor.m1v
A visual inspection of the generated video sequences shows that our model performs best when we use the linear model for the residuals. Indeed, it produces smooth video sequences that exhibit realistic behaviours. If the residuals are not used, then the generated videos contain perceptible jumps of the face, thus giving a worse overall effect. Finally, the autoregressive process produces a video with many perceptible jitters, due to the noise present in equation 8.1, which also give a worse effect.
Jitters and jumps in the generated video sequences are not taken into account in our measure of comparison. Indeed, this measure is only a crude way to assess the quality of generated video sequence.
Since comparing generated video sequences is a complicated task and depends on the psychology of humans, we have set up a psychophysical experiment to perform the assessment.